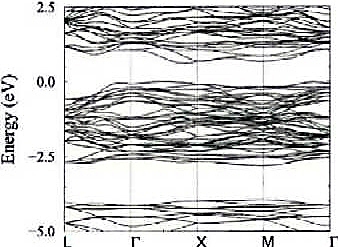
Pure Sn clathrates have never been synthesized. Instead, phases with guest atoms in the cages and with some of the framework atoms replaced by Column III atoms have been made. One such material, which is based on the Type I material Sn46, is Cs8Ga8Sn38. In this material, 8 of the Sn framework atoms are replaced by Ga's and all of the cages are filled with Cs guests. The computed electronic bandstructure for this material (electronic energy E vs. wavevector k) is shown below. Notice the multiple bands and the fact that many of them are flat. This is chararcteristic of the clathrates and is correlated with the large unit cells. We find that Cs8Ga8Sn38 is a semiconductor with an LDA bandgap of about 0.6 eV.
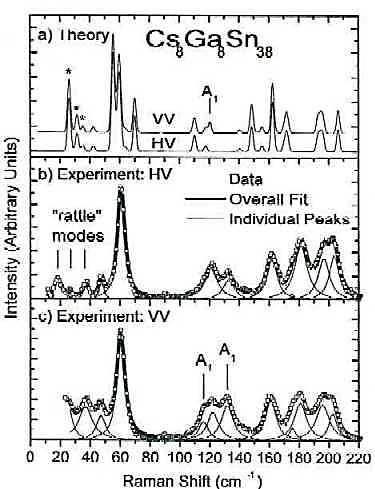
It is always satisfying to be able to successfully compare theoretical and experimental results!!! The figure below shows the theoretical (top panel) and experimental (middle & bottom panels) Raman spectra for Cs8Ga8Sn38. The theoretical lineshape is obtained by a simple semi-empirical method. The frequencies are obtained from first principles, as are all other results presented here. The experiemental data was taken by Chris Kendziora (US Naval Research Lab) on samples prepared by George Nolas (U. of South Florida). The peaks labeled by asterisks are the vibrational ("rattling") modes due to the Cs guests inside the cages. These are labeled in the experimental spectra. It is clear from this figure that our theory does an excellent job in not only predicting these observed modes. In addition, the theory clearly predicts most of the qualitative (and many of the quantitative) features of the experimental spectra. A detailed analysis shows that the theory also correctly predicts the positions of many of the experimental peaks as well as their symmetries. (See "Vibrational Properties of Tin Clathrate Materials," by C.W. Myles, J.J. Dong, O. F. Sankey, G.S. Nolas, & C. Kendziora, Phys. Rev. B 65, 235208 (2002) [PDF, 303 kB])
Recent Conference Presentations