Note: This thesis was written in 1993. Although the same CCD is being used, much of the ssupporting equipment, especially computers has been upgraded over the past 15 years. This section describes the equipment and software I used for the project. It is amazing just how far astronomical equipment has come in that time. Much of what was then cutting-edge technology, is now routinely used by back-yard observers!
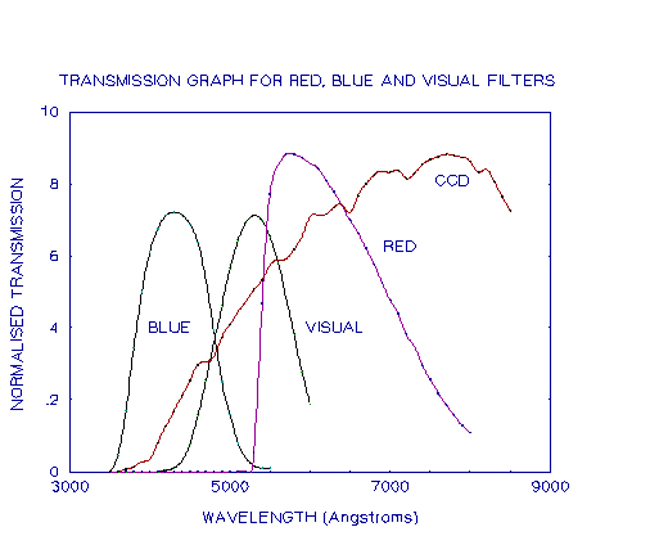
The chip has a spectral response from about 4000 A to about 10500 A so the CCD is sensitive from violet through to the infrared, although the sensitivity of the chip in the blue end of the spectrum is dying away very quickly. This means that blue filter images require substantially longer exposures to reach the same limiting magnitude than the other colours.
A second 386 SX computer controls the CCD camera, looking after such things as filter choice, exposure length, shutter operation and data acquisition. This may be operated in either a fully automatic or interactive mode. Due to some lingering bugs in the automatic mode software, the CCD system was operated in interactive mode for this project.
Image display and storage is handled by a 486 computer. Readout time is approximately 15 seconds, with a similar amount of time to clear the previous image, so the current dead time between images is about 30 seconds for identical exposures and longer if filters and exposure times are changed.
Saturation of the pixels theoretically occurs when the ADU count reaches 65536, however problems with image smear and incomplete charge transfer are expected to become noticeable before then. The filters for the CCD system are a Cousins filter set made from glass.
Images are read into the package and stored in special memory allocations called buffers. Subsequent analysis is done using these buffers. The most frequently used routines in this project were the arithmetic routines for finding the mean of several images and for flat-fielding; the TV routine for displaying images; the MARKSTAR routine to identify to the computer objects of interest in the image; and the APERSTAR routine to perform aperture photometry on the objects selected using the MARKSTAR routine. It is the APERSTAR routine that calculates the ADU count for the object under study.
Analysis was first undertaken using the PHEX program developed by D. Harwood at the Perth Observatory. This program was originally developed for use with the photometer and investigations were undertaken to examine its suitability for the CCD system.
This program takes as input the ADU count from the observations and converts them into a magnitude. From the time of the observation and the object's position, the air-mass is calculated using equation.
Using observations of standard stars, the extinction coefficients and zero points are derived by one of the methods described earlier. Deviations from the catalogue magnitudes are calculated and stars which have a residual of more than two standard deviations are excluded from the analysis. The coefficients are then used to calculate the magnitudes of other objects and the results are printed out in a list.
A second program by Kaitchuck and Henden called Astronomical Photometry with an IBM PC was used when a problem was discovered with PHEX. This package has a number of routines which are accessed individually, and the order may be varied. First, the ADU counts are converted to instrumental magnitudes. Following this there is a choice of three methods of calculating the extinction coefficients, or the second order extinction may be calculated. Alternatively, the extinction coefficients may be calculated concurrent with the transformation coefficients. These coefficients can then be used to calculate magnitudes and colour indices which can then be printed out.
This package does have a disadvantage in that unless all objects observed have been observed in more than one colour and with exactly the same set of colours each time, the program will not reduce those observations.
The second catalogue is the Zenith Star List. This catalogue is a subset of the Photometric Catalogue published by the United States Naval Observatory which covers standard stars which pass close to the zenith as seen from the Perth Observatory. This catalogue gives magnitudes and colour indices to two decimal places generally and occasionally three decimal places, for the ultraviolet, blue and visual bands. Some problems were encountered with imprecise positions being given in the catalogue and so positions for stars observed on the final three nights were derived from the Smithsonian Astrophysical Observatory catalogue.