UNIT 1 EXERCISES
1) Consider the following graph.
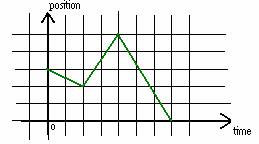
Describe in words how you would move in front of the motion detector in order to create the graph above.
2) Consider the following diagram.
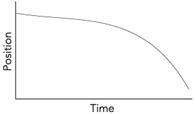
(from Workshop Physics (Electronic Version) by
Prisilla Laws, et al., John Wiley and Sons, NY, 1999)
Describe in words how you would move in front of the motion detector in order to create the graph.
3) Consider the following graphs of velocity vs. time.
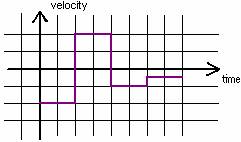
a) Describe in words how you would move
in front of the motion detector in order to
create the graph.
b) Draw the position vs. time graph that corresponds to the motion of the velocity graph.
4)
a) What would a velocity vs. time graph look like, if you were to move, not at a constant speed, but getting slower and slower and slower?
b) If you were to move slower and slower and slower at a constant rate (your velocity is decreasing at a constant rate), what would the velocity vs. time graph look like? Draw the graph.
5) A jet lands on an aircraft carrier at 63m/s. What is its average acceleration if it stops in 2.0 seconds? Show your work.
6) A car on a tilted track has an average acceleration of 19.0cm/s2. How long does it take to increase in speed from 17.0cm/s to 55.0cm/s? Show your work.
7) Consider the following graph below.
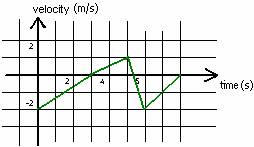
a) Draw the acceleration vs. time graph that corresponds to the motion represented by the above graph.
b) Draw a possible position vs. time graph that corresponds to the motion represented by the above graph.
8) A car initially traveling at 30.0km/hr, accelerates at the constant rate of 1.5m/s2. How far will the car travel in 15.0s?
9) An ambulance passes a red traffic light while moving at a velocity of 6.00m/s. It then accelerates at 0.30m/s2. What is the ambulance’s velocity at 15.0s?